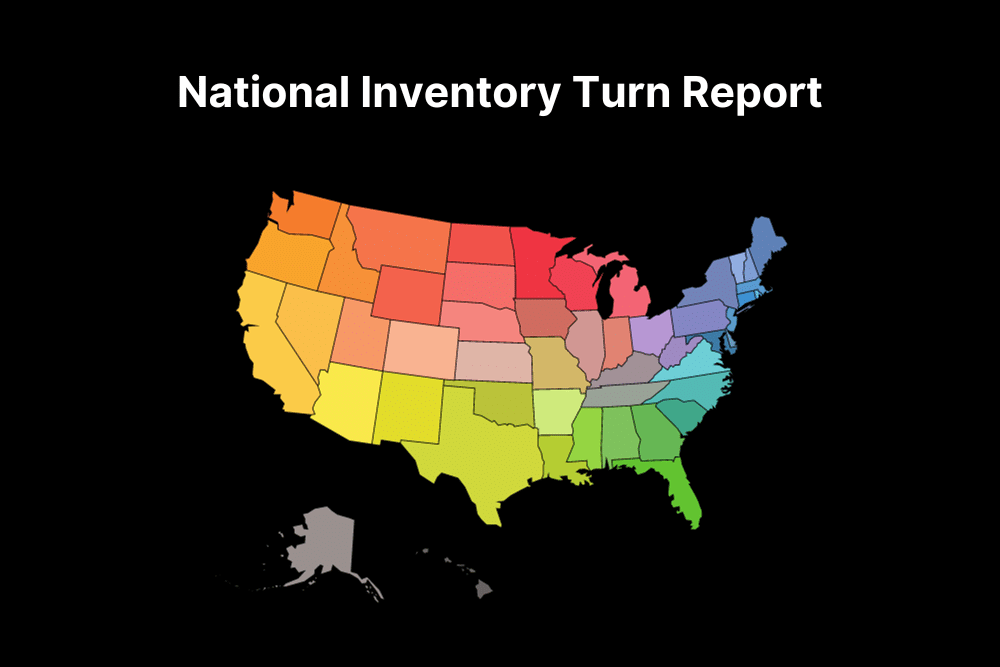
The frontline inventory at the average U.S. dealership averaged 102 days on market in September, reflecting a general slowdown in car sales that has been in motion since August.
Carketa used its own live market data of 20M+ vehicle listings to determine the average days on market across thousands of dealerships in the U.S. We looked at all 50 states and the District of Columbia in our calculations. The calculation took into account the average days on market for listings within one dealership to produce a by-dealership average to measure dealership operational health.
States with the Fastest Dealerships in America
- New Hampshire – 80.4 average days on market
- North Dakota – 82.3 average days on market
- Wisconsin – 83.0 average days on market
- Colorado – 84.2 average days on market
- Wyoming – 84.92 average days on market
Interestingly, New Hampshire is one of the few states in the U.S. with no car sales tax, potentially a factor in its fastest-in-the-nation ranking. Many northeast car buyers could be searching for low-tax deals and purchasing out of state in order to save on sales tax.
States with the Slowest Dealerships in America
- Vermont – 225.1 average days on market
- District of Columbia – 186.25 average days on market
- Nebraska – 128.6 average days on market
- New Jersey – 117.4 average days on market
- Pennsylvania – 116.6 average days on market
Notably, Vermont’s inventory turn is more than double the national average of 102 and the only state to break over 200 days in its average days on market. This could be due to the low car sales tax rates in neighboring state New Hampshire creating a softer market in the state. However, several states with higher-than-average sales tax rates on vehicles like California, Nevada and Illinois, have managed to stay more in line with the national average in days on market.
What This Means for Dealers
As reported by Cox Automotive in September, used car sales declined to 1.6 million in August, down 3.1% from July. If you’re concerned about a softening market in your area killing demand, staying ahead of the curve and continuing to adjust to market conditions quickly is key. Ask yourself these questions:
- Are you using live market data to price check your vehicles at least once a week?
- Are you looking at national vehicle price trends to ensure you build enough margin into any new vehicles you acquire at auction or trade-in?
- Have you considered shipping out of state to hotter markets to offload inventory that and take advantage or arbitrage outside your local market?
- What percentage to market do you need to be at in order to sell faster?
Staying competitive no matter the market trends requires keen attention to live market data and whether specific makes or models are trending up or down in the market so you don’t get stuck with a vehicle you can’t offload or one that will suck you dry with flooring costs before you can make a profit. To get your days on market more in line with the national average, first you have to be measuring it on a regular basis.
Check out a demo of Carketa to see our live market data in action and get a quick analysis of your frontline inventory and how competitively your inventory is priced in your local market.
Explore related articles to learn more about software solutions for car dealerships: