Introduction: Your Margin Has a Stopwatch
The moment a fresh unit rolls off the transport truck, a silent timer starts ticking. Every day that vehicle lingers on the lot, two forces conspire against you:
- Front‑end margin decay—price reductions, incentives, and lost negotiating leverage.
- Hidden holding costs—floorplan interest, insurance, depreciation, and the opportunity cost of capital.
Dealers who treat days on lot as the north‑star KPI consistently out‑earn those who manage by gut feel. Let’s unpack the data, the seasonality, and the exact workflow that keeps inventory turning before gross profit evaporates.
1. Why “Days on Lot” Deserves a Permanent Spot on Your Dashboard
Recent Cox Automotive studies put the break‑even point for many used units at 30–35 days; after that, every additional day trims roughly $35 in net profit. That figure jumps north of $50/day for high-cost floorplans or specialty vehicles. Multiply that by a 150‑car lot and the math is brutal:
$35/day × 150 units × 10 extra days = $52,500 in lost profit
Yet the average U.S. dealer still carries ≈48 days of supply. In other words, most stores are operating in the danger zone half the month. Tightening that average by just five days can unlock six figures annually.
2. The Economics in One Picture
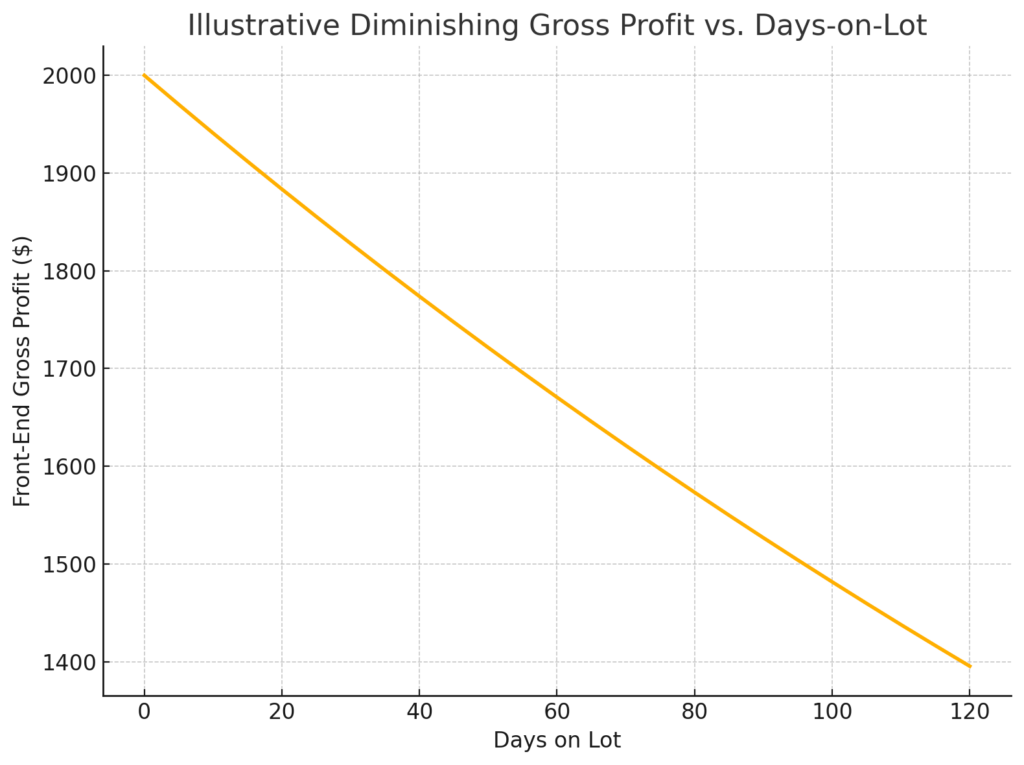
Notice how the slope is steepest through the first 45 days. That’s the “profit knee”—the point where retail value and wholesale value converge. Your strategy is simple:
- Retail before the knee to capture full margin.
- Discount quickly if the unit approaches the knee.
- Wholesale decisively once it crosses.
Failing to act in time often means selling below auction value just to move metal.
3. The Hold → Discount → Wholesale Decision Tree (Expanded)
| Age Bucket | Primary Goal | Key Metrics to Watch | Typical Actions |
| 0–15 days | Maximize gross | VDP views, photo count, description quality | Full re‑merchandising push: 40+ photos, video walk‑around, social blast |
| 16–30 days | Maintain gross / build urgency | Price‑to‑market ≤ 100 %, search impressions trending up | Refresh photos, adjust copy, consider minor price tweak |
| 31–45 days | Accelerate turn | Price gap vs. comps ≥ $500, VDP views plateau | $250–$500 discount, feature in email blast, move to front row |
| 46–60 days | Protect capital | Aging > 45 days, days’ supply rising, recon queue backing up | Deeper discount, appraise for auction, solicit instant offers |
| 60 + days | Free capital | Floorplan + recon > expected front‑end | Wholesale immediately, replace with faster‑moving segment |
4. Seasonality: When the Curve Bends in Your Favor
1. Tax-Time Pop (Feb-Apr)
- Refund checks boost sub‑$20K inventory.
- Stretch the Hold zone to 40 days for budget cars; tighten to 25 days for luxury models.
2. Summer Travel Surge (May – Jul)
- SUVs, vans, and trucks fly off the lot.
- Keep those body styles in stock a touch longer; accelerate discounts on compact sedans.
3. Model‑Year Changeover (Aug – Sep)
- New‑car incentives hit, dragging down late‑model used values.
- Move 12‑ to 18‑month‑old inventory by day 35 to avoid steep book drops.
4. Holiday Lull (Oct – Dec)
- Retail foot traffic slows, but wholesale lanes stay active.
- Wholesale or send to e‑commerce channels by 45 days to avoid winter carrying costs.
Because these swings aren’t uniform across markets, Carketa lets you filter the Inventory Age dashboard by date range and vehicle segment—so you see your store’s curve, not just a national average.
5. Building a Days‑on‑Lot Playbook (Process Over Luck)
1. Set a Hard Target
- Example: 85 % of inventory retailed within 30 days.
2. Inspect Daily
- Morning stand‑up: review the Inventory Age dashboard, flag units crossing thresholds.
3. Assign Ownership
- Sales manager owns discount decisions; used‑car manager owns wholesale calls.
4. Automate Report
- Schedule a Monday e‑mail of “Units 31‑45 Days & Above Market.”
5. Celebrate Wins
- Spiff the team for shaving average days on lot each month.
Dealers who ritualize this cadence often see average age drop by 7–10 days within one quarter.
6. Carketa Walk‑Through: Turning Data into Action in 90 Seconds
1. Open the Inventory Age Dashboard
- Buckets are pre‑built: 0‑15, 16‑30, 31‑45, 46‑60, 61‑75, 76‑90, 91‑120, 121 +.
2. Sort by “Above Market %”
- Instantly reveals units priced too high for their age bucket.
3. Apply the “31‑45 Days” Filter
- Generates a working list for today’s discount meeting.
4. Save the View
- Next time you log in, the same filter loads automatically—no spreadsheet wrangling.
That’s data‑driven inventory management without the spreadsheet headache.
7. Recon‑Speed Multiplier: What 3 Fewer Days Really Means for Gross
Industry research puts the average recon cycle at 7–8 days, while top‑performing stores clock in at 3–4 days. Let’s run the math on what trimming just three days does for a 100‑unit lot:
| Metric | Rule of Thumb | 3‑Day Savings |
| Front‑end margin decay | ≈ $40 per unit, per day² | $12,000 |
| Floorplan & holding cost | ≈ $15 per unit, per day³ | $4,500 |
| Total monthly upside | — | $16,500 |
How to Capture Those Days with Carketa
1. Days-in-Recon report – pinpoints the exact steps causing drag.
2. Time‑in‑Step drill‑down – reveals whether the holdup is parts, approvals, or vendor scheduling.
3. Vendor Assignment board – lets you re‑route work.
4. Recon Expenses tracking – keeps cost creep in check while you speed things up.
Benchmark: Dealers who set a 3‑day recon target and monitor the Days‑in‑Recon widget daily typically shave 2–4 days off cycle time within one quarter.
Conclusion & CTA
Every dealer knows aging is expensive, but few can see the cost until it’s too late. Carketa’s real‑time Inventory Age dashboard makes the invisible visible, empowering you to retail sooner, discount smarter, and wholesale faster.
Book a 10‑minute demo and watch Carketa surface your profit leaks live.
Stop guessing. Start turning.